Today, PointGuard announced the addition of new scatterplot data visualizations to the PointGuard Platform™. These enhancements to the Platform Tools promise to further increase productivity for facility and property managers. PointGuard’s mission has always been to give its customers clarity on exactly what is happening in their buildings related to their HVAC systems. It aims to give its customers real-time, actionable insight on exactly where to turn the wrench to make effective improvements. Today’s platform additions further this mission.
“These enhancements make the data curation process easier for our users, and weaponize their ability to curate more square footage in their limited time,” said Shannon Smith, PointGuard CEO.
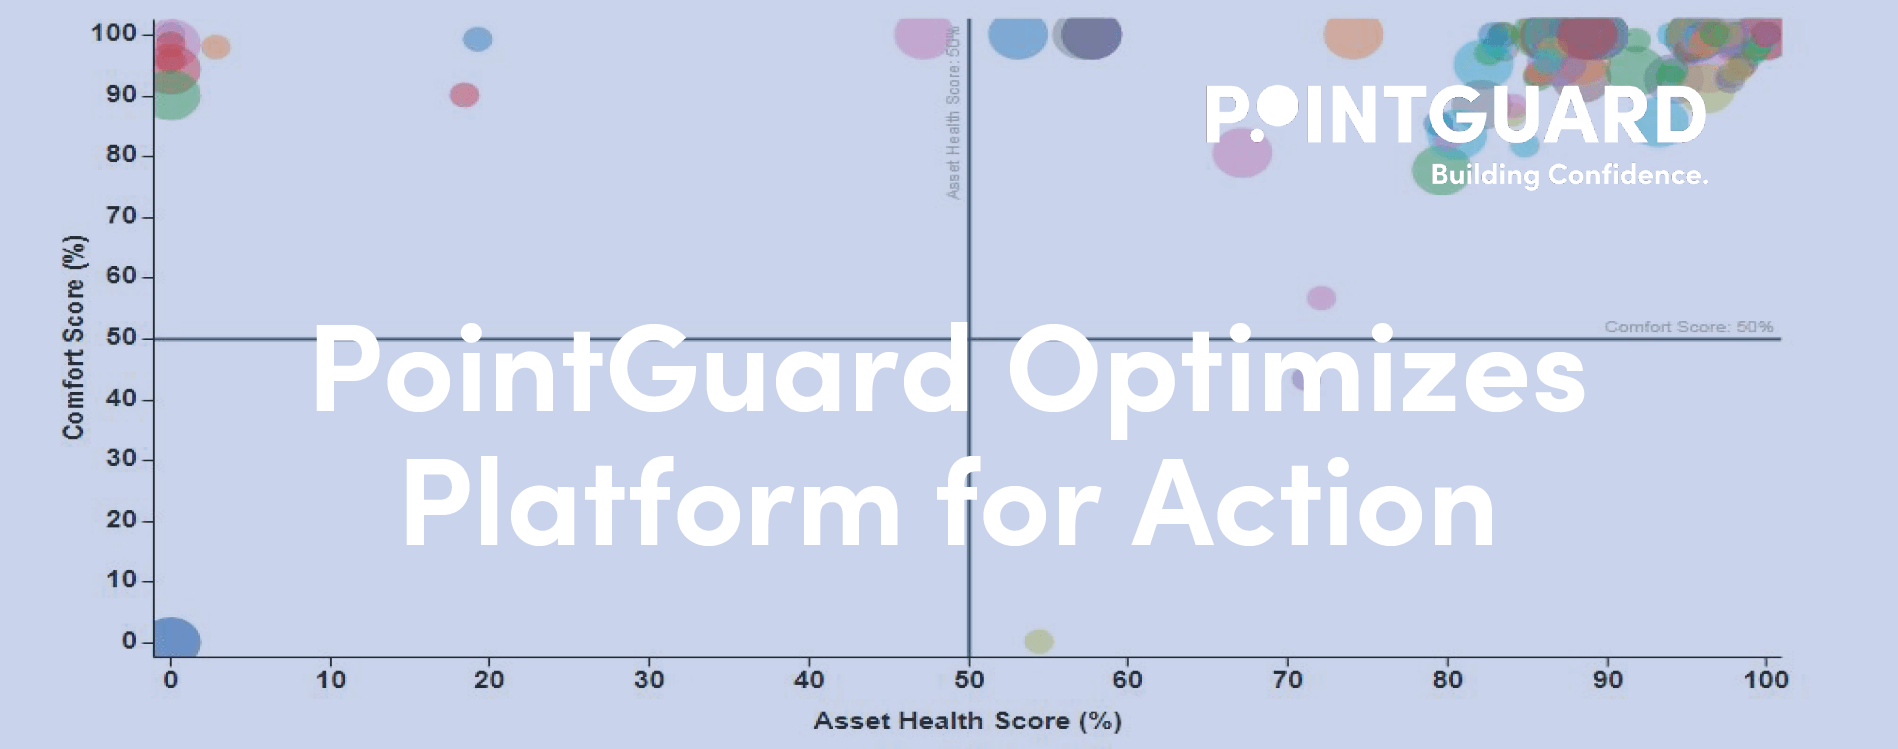
In practice, the new scatterplot visualization works with existing trend data available on the platform. While trend data gives users a bird’s eye view of everything happening across the building, the scatterplot highlights outlier data which may indicate a piece of equipment that needs immediate attention. This narrows down the data from a couple hundred trend indicators, to typically around ten items that the facility or property manager should pay attention to, helping them prioritize their resources and focus.
Furthermore, Platform users can also utilize the scatterplot to unlock additional information such as run time and set point management by clicking on the individual data point. Facilities managers can take this objective data, add in their local knowledge of their buildings, and better determine follow up action. This may streamline a wait and see approach, until enough faults exist to warrant rolling a truck or hiring a contractor to resolve them cost effectively.
“Trend data is great, but you need to know what to pay attention to, especially in a fast-changing, complex environment, with limited, existing resources,” says Smith. “By identifying the larger faults that have the most impact and may cost the most money, building and facilities managers can prioritize their efforts to achieve optimal outcomes most efficiently.”
Customers who currently hold a PointGuard platform license will immediately have access to the scatterplot visualizations on the General Analysis page, as well as the Sparks Analysis Visualization.
Get in touch to learn more!